visualizing sw files
Happy to announce I made some major progress in the last couple of days! I discovered a nice tidy graph description language called DOT, and realized with not much work I could convert my sw files to DOT, and then use graphviz to plot the graphs. Suddenly, my math-looking sw files can now be made into pretty pictures (at least for smaller sw files. I tried names.sw but graphviz crashed out!).
This means I now have 4 ways to vizualize my sw data:
1) matrices
2) tables
3) bar charts
4) these network graphs
Now, let's give some examples.
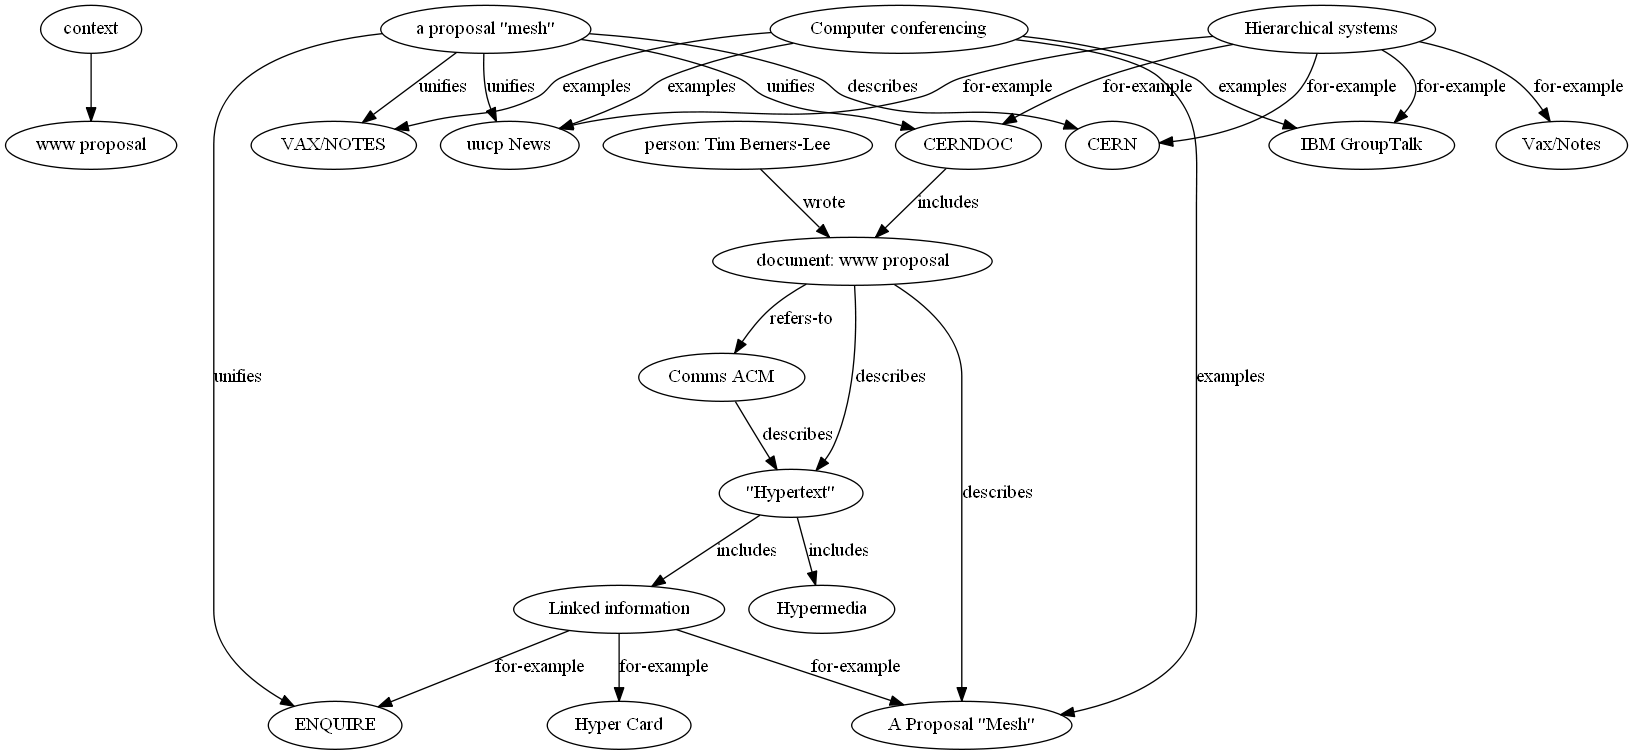
Let's start with our earliest example, the www-document flow-chart.
For comparison, here is the sw:
|context> => |context: www proposal>

describes |document: www proposal> => |"Hypertext"> + |A Proposal "Mesh">
refers-to |document: www proposal> => |Comms ACM>
describes |Comms ACM> => |"Hypertext">
includes |"Hypertext"> => |Linked information> + |Hypermedia>
for-example |Linked information> => |Hyper Card> + |ENQUIRE> + |A Proposal "Mesh">
describes |a proposal "mesh"> => |CERN>
unifies |a proposal "mesh"> => |ENQUIRE> + |VAX/NOTES> + |uucp News> + |CERNDOC>
examples |Computer conferencing> => |IBM GroupTalk> + |uucp News> + |VAX/NOTES> + |A Proposal "Mesh">
for-example |Hierarchical systems> => |CERN> + |CERNDOC> + |Vax/Notes> + |uucp News> + |IBM GroupTalk>
includes |CERNDOC> => |document: www proposal>
wrote |person: Tim Berners-Lee> => |document: www proposal>
Here it is in DOT:
$ cat graph-examples/www-proposal.dot
digraph g {
context -> context_name
context_name [label="www proposal"]
n0 -> n1 [label="describes",arrowhead="normal"]
n0 -> n2 [label="describes",arrowhead="normal"]
n0 -> n3 [label="refers-to",arrowhead="normal"]
n3 -> n1 [label="describes",arrowhead="normal"]
n1 -> n4 [label="includes",arrowhead="normal"]
n1 -> n5 [label="includes",arrowhead="normal"]
n4 -> n6 [label="for-example",arrowhead="normal"]
n4 -> n7 [label="for-example",arrowhead="normal"]
n4 -> n2 [label="for-example",arrowhead="normal"]
n8 -> n9 [label="describes",arrowhead="normal"]
n8 -> n7 [label="unifies",arrowhead="normal"]
n8 -> n10 [label="unifies",arrowhead="normal"]
n8 -> n11 [label="unifies",arrowhead="normal"]
n8 -> n12 [label="unifies",arrowhead="normal"]
n13 -> n14 [label="examples",arrowhead="normal"]
n13 -> n11 [label="examples",arrowhead="normal"]
n13 -> n10 [label="examples",arrowhead="normal"]
n13 -> n2 [label="examples",arrowhead="normal"]
n15 -> n9 [label="for-example",arrowhead="normal"]
n15 -> n12 [label="for-example",arrowhead="normal"]
n15 -> n16 [label="for-example",arrowhead="normal"]
n15 -> n11 [label="for-example",arrowhead="normal"]
n15 -> n14 [label="for-example",arrowhead="normal"]
n12 -> n0 [label="includes",arrowhead="normal"]
n17 -> n0 [label="wrote",arrowhead="normal"]
n6 [label="Hyper Card"]
n1 [label="\"Hypertext\""]
n17 [label="person: Tim Berners-Lee"]
n10 [label="VAX/NOTES"]
n13 [label="Computer conferencing"]
n4 [label="Linked information"]
n7 [label="ENQUIRE"]
n2 [label="A Proposal \"Mesh\""]
n3 [label="Comms ACM"]
n5 [label="Hypermedia"]
n8 [label="a proposal \"mesh\""]
n14 [label="IBM GroupTalk"]
n16 [label="Vax/Notes"]
n9 [label="CERN"]
n11 [label="uucp News"]
n12 [label="CERNDOC"]
n15 [label="Hierarchical systems"]
n0 [label="document: www proposal"]
}
Here it is after graphviz does its thing:
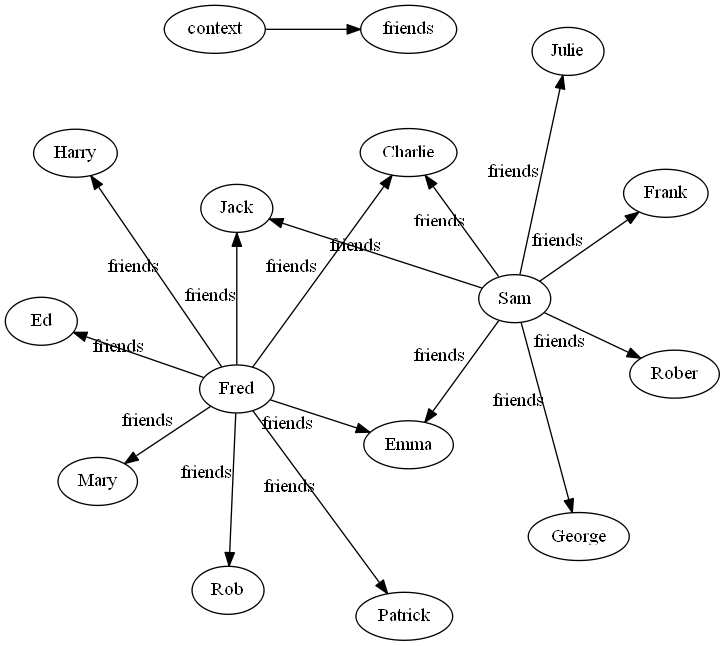
Here is another example. First the sw:
|context> => |context: friends>

friends |Fred> => |Jack> + |Harry> + |Ed> + |Mary> + |Rob> + |Patrick> + |Emma> + |Charlie>
friends |Sam> => |Charlie> + |George> + |Emma> + |Jack> + |Rober> + |Frank> + |Julie>
Here is the DOT:
digraph g {
context -> context_name
context_name [label="friends"]
n0 -> n1 [label="friends",arrowhead="normal"]
n0 -> n2 [label="friends",arrowhead="normal"]
n0 -> n3 [label="friends",arrowhead="normal"]
n0 -> n4 [label="friends",arrowhead="normal"]
n0 -> n5 [label="friends",arrowhead="normal"]
n0 -> n6 [label="friends",arrowhead="normal"]
n0 -> n7 [label="friends",arrowhead="normal"]
n0 -> n8 [label="friends",arrowhead="normal"]
n9 -> n8 [label="friends",arrowhead="normal"]
n9 -> n10 [label="friends",arrowhead="normal"]
n9 -> n7 [label="friends",arrowhead="normal"]
n9 -> n1 [label="friends",arrowhead="normal"]
n9 -> n11 [label="friends",arrowhead="normal"]
n9 -> n12 [label="friends",arrowhead="normal"]
n9 -> n13 [label="friends",arrowhead="normal"]
n6 [label="Patrick"]
n9 [label="Sam"]
n8 [label="Charlie"]
n7 [label="Emma"]
n11 [label="Rober"]
n13 [label="Julie"]
n10 [label="George"]
n0 [label="Fred"]
n5 [label="Rob"]
n2 [label="Harry"]
n1 [label="Jack"]
n4 [label="Mary"]
n12 [label="Frank"]
n3 [label="Ed"]
}
And after graphviz does its thing:
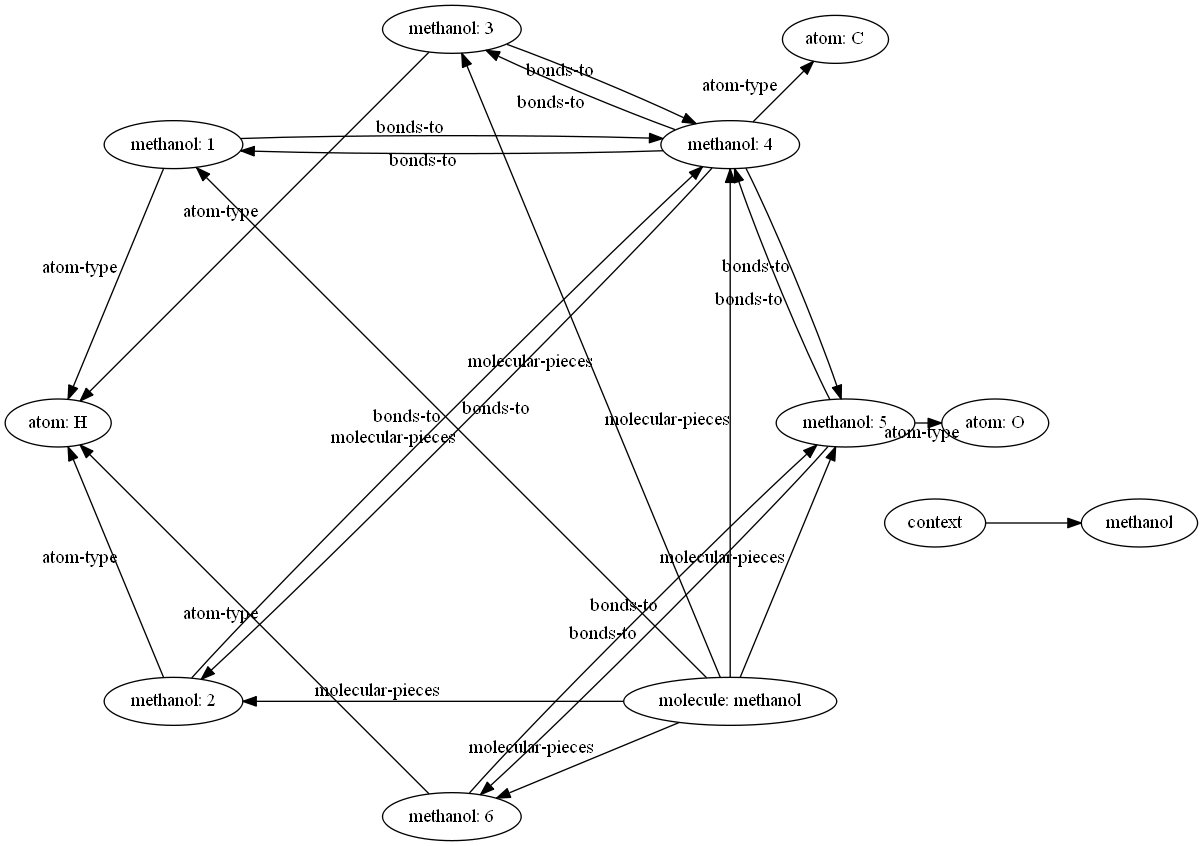
Here is methanol.sw:
|context> => |context: methanol>

molecular-pieces |molecule: methanol> => |methanol: 1> + |methanol: 2> + |methanol: 3> + |methanol: 4> + |methanol: 5> + |methanol: 6>

atom-type |methanol: 1> => |atom: H>
bonds-to |methanol: 1> => |methanol: 4>

atom-type |methanol: 2> => |atom: H>
bonds-to |methanol: 2> => |methanol: 4>

atom-type |methanol: 3> => |atom: H>
bonds-to |methanol: 3> => |methanol: 4>

atom-type |methanol: 4> => |atom: C>
bonds-to |methanol: 4> => |methanol: 1> + |methanol: 2> + |methanol: 3> + |methanol: 5>

atom-type |methanol: 5> => |atom: O>
bonds-to |methanol: 5> => |methanol: 4> + |methanol: 6>

atom-type |methanol: 6> => |atom: H>
bonds-to |methanol: 6> => |methanol: 5>
Here is methanol.dot:
digraph g {
context -> context_name
context_name [label="methanol"]
n0 -> n1 [label="molecular-pieces",arrowhead="normal"]
n0 -> n2 [label="molecular-pieces",arrowhead="normal"]
n0 -> n3 [label="molecular-pieces",arrowhead="normal"]
n0 -> n4 [label="molecular-pieces",arrowhead="normal"]
n0 -> n5 [label="molecular-pieces",arrowhead="normal"]
n0 -> n6 [label="molecular-pieces",arrowhead="normal"]
n1 -> n7 [label="atom-type",arrowhead="normal"]
n1 -> n4 [label="bonds-to",arrowhead="normal"]
n2 -> n7 [label="atom-type",arrowhead="normal"]
n2 -> n4 [label="bonds-to",arrowhead="normal"]
n3 -> n7 [label="atom-type",arrowhead="normal"]
n3 -> n4 [label="bonds-to",arrowhead="normal"]
n4 -> n8 [label="atom-type",arrowhead="normal"]
n4 -> n1 [label="bonds-to",arrowhead="normal"]
n4 -> n2 [label="bonds-to",arrowhead="normal"]
n4 -> n3 [label="bonds-to",arrowhead="normal"]
n4 -> n5 [label="bonds-to",arrowhead="normal"]
n5 -> n9 [label="atom-type",arrowhead="normal"]
n5 -> n4 [label="bonds-to",arrowhead="normal"]
n5 -> n6 [label="bonds-to",arrowhead="normal"]
n6 -> n7 [label="atom-type",arrowhead="normal"]
n6 -> n5 [label="bonds-to",arrowhead="normal"]
n6 [label="methanol: 6"]
n0 [label="molecule: methanol"]
n2 [label="methanol: 2"]
n4 [label="methanol: 4"]
n3 [label="methanol: 3"]
n9 [label="atom: O"]
n5 [label="methanol: 5"]
n8 [label="atom: C"]
n1 [label="methanol: 1"]
n7 [label="atom: H"]
}
Here is methanol.png:
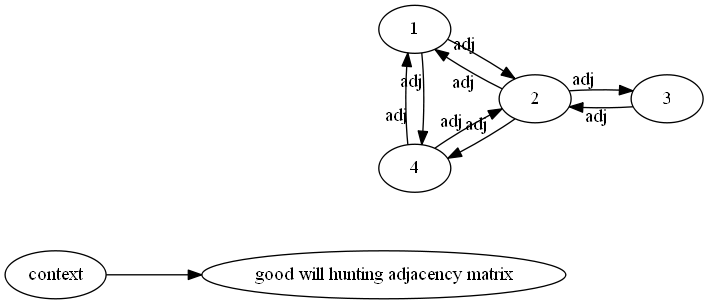
Here is the adjacency matrix from the movie "Good Will Hunting":
|context> => |context: good will hunting adjacency matrix>

adj |1> => |2> + |4>
adj |2> => |1> + |4> + 2|3>
adj |3> => 2|2>
adj |4> => |1> + |2>
Here is good-will-hunting-adjacency-matrix.dot:
digraph g {
context -> context_name
context_name [label="good will hunting adjacency matrix"]
n0 -> n1 [label="adj",arrowhead="normal"]
n0 -> n2 [label="adj",arrowhead="normal"]
n1 -> n0 [label="adj",arrowhead="normal"]
n1 -> n2 [label="adj",arrowhead="normal"]
n1 -> n3 [label="adj",arrowhead="normal"]
n3 -> n1 [label="adj",arrowhead="normal"]
n2 -> n0 [label="adj",arrowhead="normal"]
n2 -> n1 [label="adj",arrowhead="normal"]
n3 [label="3"]
n0 [label="1"]
n2 [label="4"]
n1 [label="2"]
}
Here is the graph:
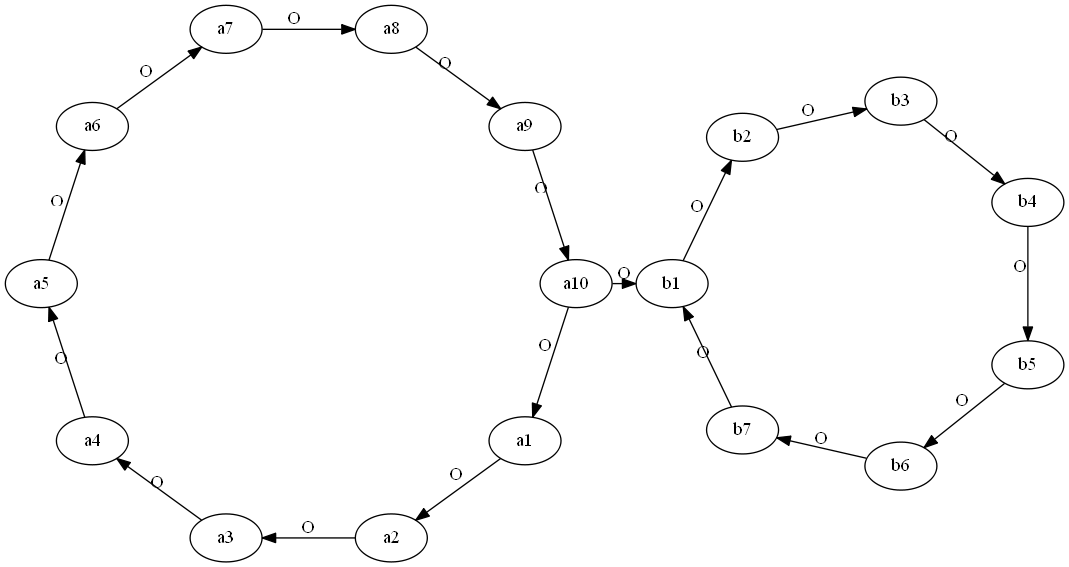
Here is a simple network:
O |a1> => |a2>
O |a2> => |a3>
O |a3> => |a4>
O |a4> => |a5>
O |a5> => |a6>
O |a6> => |a7>
O |a7> => |a8>
O |a8> => |a9>
O |a9> => |a10>
O |a10> => |a1> + |b1>

O |b1> => |b2>
O |b2> => |b3>
O |b3> => |b4>
O |b4> => |b5>
O |b5> => |b6>
O |b6> => |b7>
O |b7> => |b1>
Here is the DOT:
digraph g {
n0 -> n1 [label="O",arrowhead="normal"]
n1 -> n2 [label="O",arrowhead="normal"]
n2 -> n3 [label="O",arrowhead="normal"]
n3 -> n4 [label="O",arrowhead="normal"]
n4 -> n5 [label="O",arrowhead="normal"]
n5 -> n6 [label="O",arrowhead="normal"]
n6 -> n7 [label="O",arrowhead="normal"]
n7 -> n8 [label="O",arrowhead="normal"]
n8 -> n9 [label="O",arrowhead="normal"]
n9 -> n0 [label="O",arrowhead="normal"]
n9 -> n10 [label="O",arrowhead="normal"]
n10 -> n11 [label="O",arrowhead="normal"]
n11 -> n12 [label="O",arrowhead="normal"]
n12 -> n13 [label="O",arrowhead="normal"]
n13 -> n14 [label="O",arrowhead="normal"]
n14 -> n15 [label="O",arrowhead="normal"]
n15 -> n16 [label="O",arrowhead="normal"]
n16 -> n10 [label="O",arrowhead="normal"]
n16 [label="b7"]
n3 [label="a4"]
n6 [label="a7"]
n0 [label="a1"]
n13 [label="b4"]
n15 [label="b6"]
n4 [label="a5"]
n11 [label="b2"]
n9 [label="a10"]
n7 [label="a8"]
n5 [label="a6"]
n12 [label="b3"]
n2 [label="a3"]
n10 [label="b1"]
n14 [label="b5"]
n1 [label="a2"]
n8 [label="a9"]
}
Here is the image:
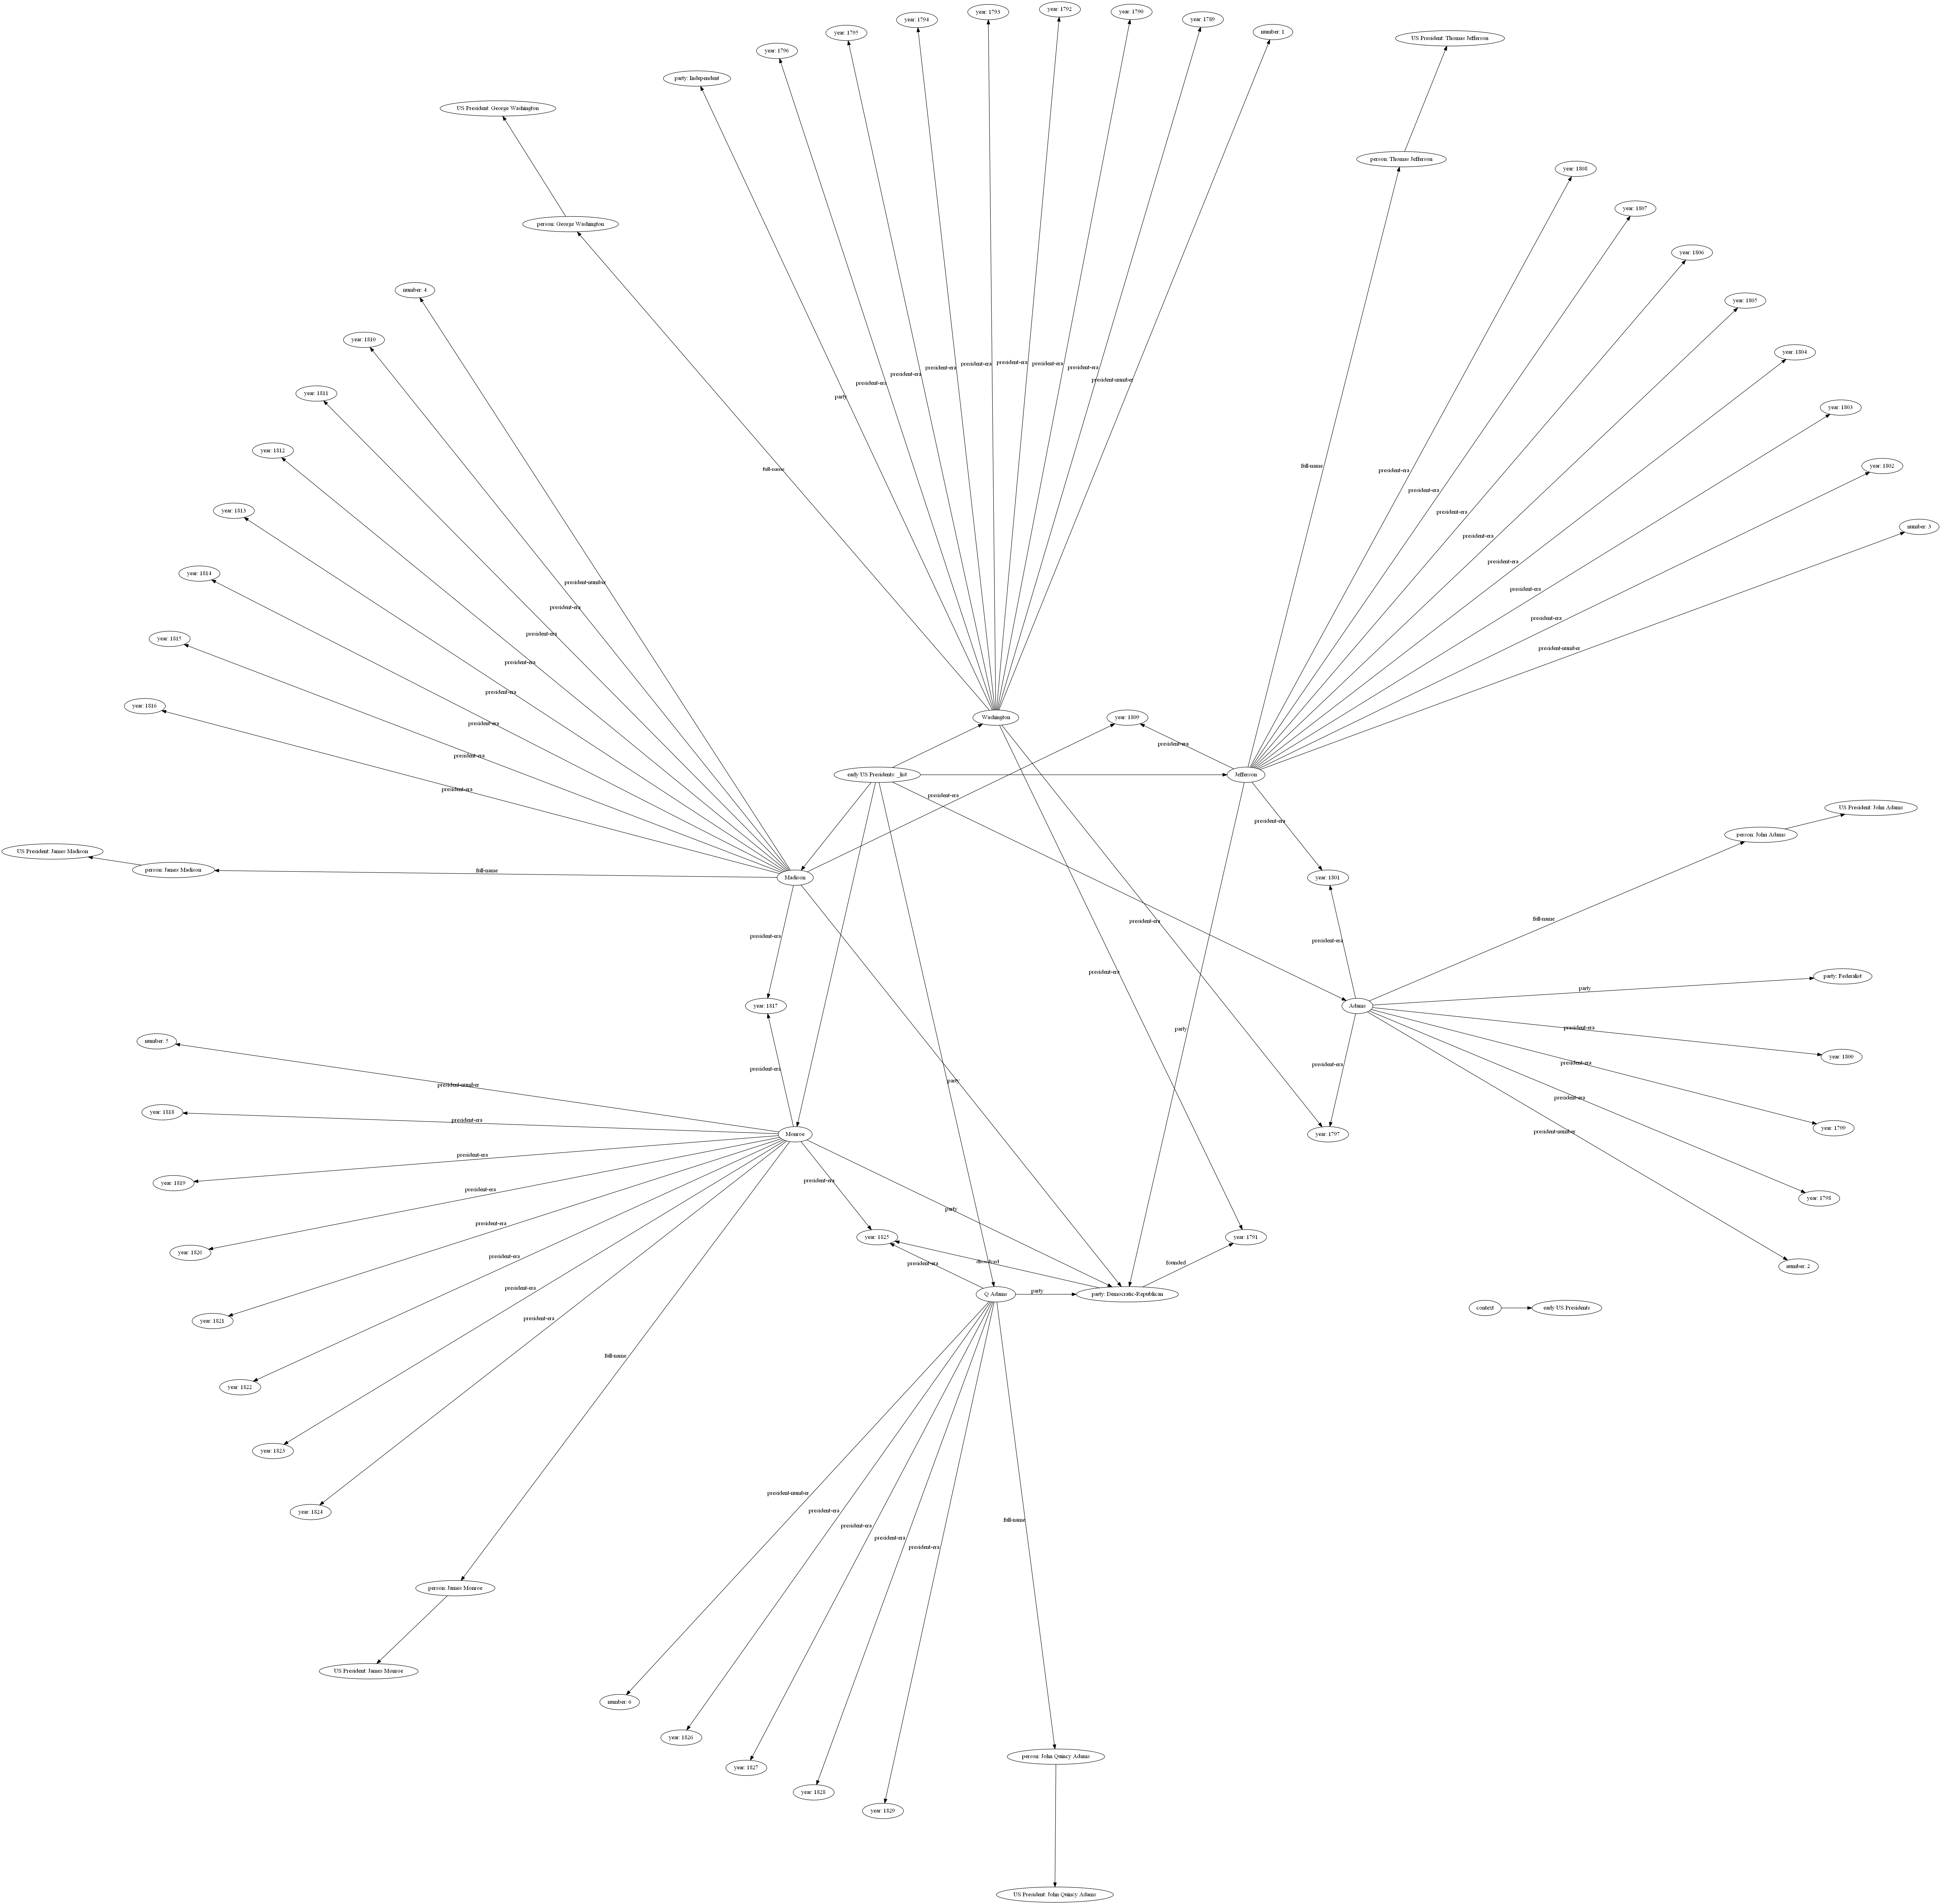
And finally, let's finish with the early US presidents.
sw-file, dot-file, and the image:
Anyway, all nice and pretty!
Some more dot files and png files.
Home
previous: revisiting wikipedia inverse links to semantic similarities
next: update on visualizing sw files
updated: 19/12/2016
by Garry Morrison
email: garry -at- semantic-db.org